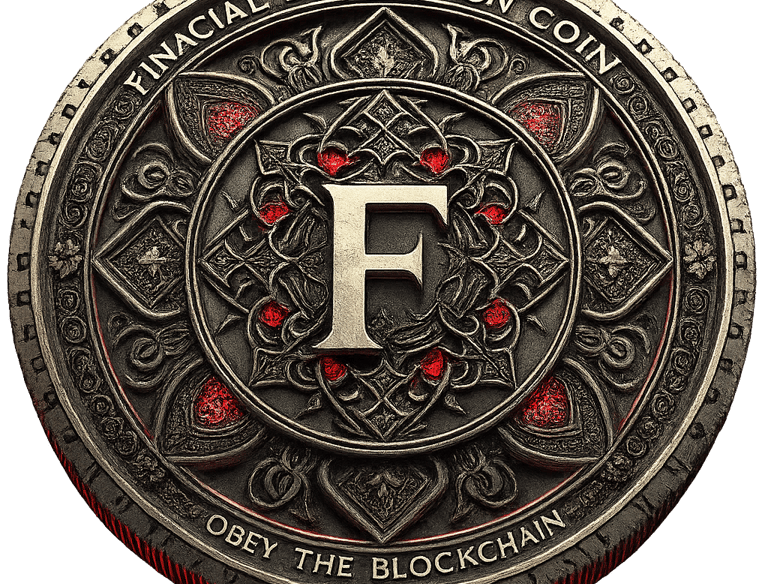
findom — obey the blockchain.

findom (fndm) ist ein Token für finanzielle Hingabe und digitale Dominanz auf Solana.

Token der Hingabe.
woman in red lingerie kneeling on floor

Erlebe Kontrolle und Macht mit findom, deinem digitalen Token für finanzielle Submission.

red moon
red moon
Macht und Kontrolle.

Entdecke die Welt von findom und erlebe die digitale Dominanz in deinem Portfolio.

Erlebe die Dunkelheit und Geheimnis um findom, das Symbol finanzieller Hingabe.

Dunkler, geheimnisvoller Stil.

Findom Token

Ein Symbol finanzieller Hingabe und digitaler Dominanz auf Solana.

A financial chart displaying a downward trend with multiple sharp peaks and valleys. The chart features predominantly red and green candlesticks against a dark background, indicating fluctuations in market values.
A computer monitor displays a cryptocurrency exchange interface with various graphs, charts, and numerical data. On the left side, there are options for buying and selling, as well as a list of recent trades. The main graph on the right shows a price chart with a candlestick pattern, indicating fluctuations in the market over a period of time.
A tablet displaying a detailed digital financial trading interface with various graphs, charts, and numerical data. The screen shows candlestick charts with green and red indicators, illustrating market trends and stock prices.
Multiple cryptocurrency logos including Ethereum, Tezos, Bitcoin, and Dogecoin are depicted over a digital grid composed of interconnected blue circles creating a wave-like pattern. The background is dark, enhancing the visibility of the logos and grid.